| Arquivo: index.html |
| <!doctype html> <html lang="pt-br"> <head> <meta charset="utf-8"> <meta name="viewport" content="width=device-width, initial-scale=1.0"> <title>Gráficos HTML</title> </head> <script src="https://www.gstatic.com/charts/loader.js"></script> <script> google.charts.load('current',{packages:['corechart']}); google.charts.setOnLoadCallback(drawChart); // Your Function function drawChart() { // Aqui que coloca o codigo } </script> <body> <div id="myChart" style="max-width:700px; height:400px"></div> </body> </html> |
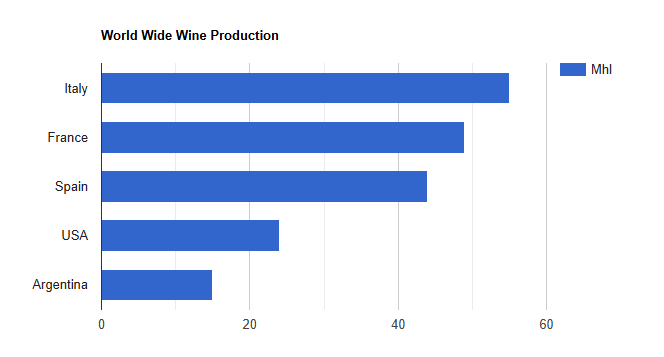
| function drawChart() { // Set Data const data = google.visualization.arrayToDataTable([ ['Contry', 'Mhl'], ['Italy', 55], ['France', 49], ['Spain', 44], ['USA', 24], ['Argentina', 15] ]); // Set Options const options = { title: 'World Wide Wine Production' }; // Draw const chart = new google.visualization.BarChart(document.getElementById('myChart')); chart.draw(data, options); } |
| Arquivo: index.html |
| <!doctype html> <html lang="pt-br"> <head> <meta charset="utf-8"> <meta name="viewport" content="width=device-width, initial-scale=1.0"> <title>Gráficos HTML</title> </head> <script src="https://www.gstatic.com/charts/loader.js"></script> <script> google.charts.load('current',{packages:['corechart']}); google.charts.setOnLoadCallback(drawChart); // Your Function function drawChart() { // Set Data const data = google.visualization.arrayToDataTable([ ['Contry', 'Mhl'], ['Italy', 55], ['France', 49], ['Spain', 44], ['USA', 24], ['Argentina', 15] ]); // Set Options const options = { title: 'World Wide Wine Production' }; // Draw const chart = new google.visualization.BarChart(document.getElementById('myChart')); chart.draw(data, options); } </script> <body> <div id="myChart" style="max-width:700px; height:400px"></div> </body> </html> |
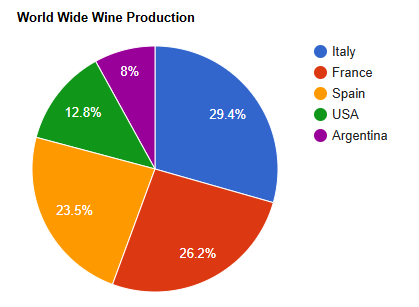
| const chart = new google.visualization. PieChart(document.getElementById('myChart')); |
| Arquivo: index.html |
| <!doctype html> <html lang="pt-br"> <head> <meta charset="utf-8"> <meta name="viewport" content="width=device-width, initial-scale=1.0"> <title>Gráficos HTML</title> </head> <script src="https://www.gstatic.com/charts/loader.js"></script> <script> google.charts.load('current',{packages:['corechart']}); google.charts.setOnLoadCallback(drawChart); // Your Function function drawChart() { // Set Data const data = google.visualization.arrayToDataTable([ ['Contry', 'Mhl'], ['Italy', 55], ['France', 49], ['Spain', 44], ['USA', 24], ['Argentina', 15] ]); // Set Options const options = { title: 'World Wide Wine Production' }; // Draw const chart = new google.visualization.PieChart(document.getElementById('myChart')); chart.draw(data, options); } </script> <body> <div id="myChart" style="max-width:700px; height:400px"></div> </body> </html> |
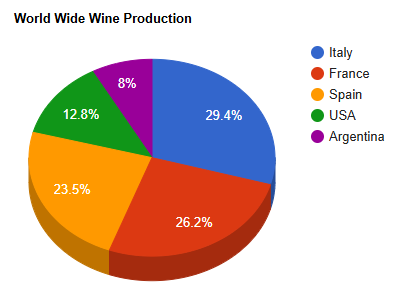
| const options = { title: 'World Wide Wine Production', is3D: true }; |
| Arquivo: Index.html |
| <!doctype html> <html lang="pt-br"> <head> <meta charset="utf-8"> <meta name="viewport" content="width=device-width, initial-scale=1.0"> <title>Gráficos HTML</title> </head> <script src="https://www.gstatic.com/charts/loader.js"></script> <script> google.charts.load('current',{packages:['corechart']}); google.charts.setOnLoadCallback(drawChart); // Your Function function drawChart() { // Set Data const data = google.visualization.arrayToDataTable([ ['Contry', 'Mhl'], ['Italy', 55], ['France', 49], ['Spain', 44], ['USA', 24], ['Argentina', 15] ]); const options = { title: 'World Wide Wine Production', is3D: true }; // Draw const chart = new google.visualization.PieChart(document.getElementById('myChart')); chart.draw(data, options); } </script> <body> <div id="myChart" style="max-width:700px; height:400px"></div> </body> </html> |
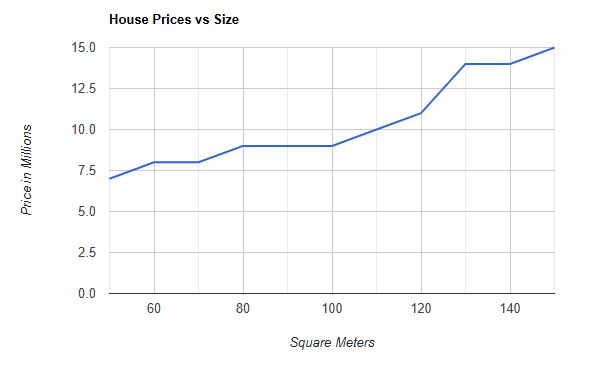
| function drawChart() { // Set Data const data = google.visualization.arrayToDataTable([ ['Price', 'Size'], [50,7],[60,8],[70,8],[80,9],[90,9],[100,9], [110,10],[120,11],[130,14],[140,14],[150,15] ]); // Set Options const options = { title: 'House Prices vs Size', hAxis: {title: 'Square Meters'}, vAxis: {title: 'Price in Millions'}, legend: 'none' }; // Draw Chart const chart = new google.visualization.LineChart(document.getElementById('myChart')); chart.draw(data, options); } |
| Arquivo: Index.html |
| <!doctype html> <html lang="pt-br"> <head> <meta charset="utf-8"> <meta name="viewport" content="width=device-width, initial-scale=1.0"> <title>Gráficos HTML</title> </head> <script src="https://www.gstatic.com/charts/loader.js"></script> <script> google.charts.load('current',{packages:['corechart']}); google.charts.setOnLoadCallback(drawChart); // Your Function function drawChart() {// Set Data const data = google.visualization.arrayToDataTable([ ['Price', 'Size'], [50,7],[60,8],[70,8],[80,9],[90,9],[100,9], [110,10],[120,11],[130,14],[140,14],[150,15] ]); // Set Options const options = { title: 'House Prices vs Size', hAxis: {title: 'Square Meters'}, vAxis: {title: 'Price in Millions'}, legend: 'none' }; // Draw Chart const chart = new google.visualization.LineChart(document.getElementById('myChart')); chart.draw(data, options); } </script> <body> <div id="myChart" style="max-width:700px; height:400px"></div> </body> </html> |
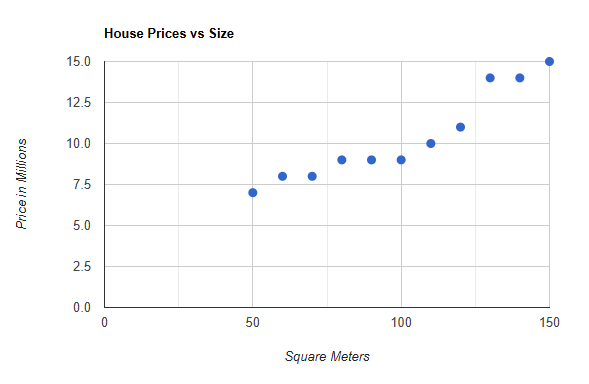
| const chart = new google.visualization.ScatterChart(document.getElementById('myChart')); |
| Arquivo: index.html |
| <!doctype html> <html lang="pt-br"> <head> <meta charset="utf-8"> <meta name="viewport" content="width=device-width, initial-scale=1.0"> <title>Gráficos HTML</title> </head> <script src="https://www.gstatic.com/charts/loader.js"></script> <script> google.charts.load('current',{packages:['corechart']}); google.charts.setOnLoadCallback(drawChart); // Your Function function drawChart() {// Set Data const data = google.visualization.arrayToDataTable([ ['Price', 'Size'], [50,7],[60,8],[70,8],[80,9],[90,9],[100,9], [110,10],[120,11],[130,14],[140,14],[150,15] ]); // Set Options const options = { title: 'House Prices vs Size', hAxis: {title: 'Square Meters'}, vAxis: {title: 'Price in Millions'}, legend: 'none' }; // Draw Chart const chart = new google.visualization.ScatterChart(document.getElementById('myChart')); chart.draw(data, options); } </script> <body> <div id="myChart" style="max-width:700px; height:400px"></div> </body> </html> |